You can limit the results displayed in a visualization to a subset of the rows returned from an ordered set of data. "Top N" is the set of results at the top of an ordered set. "N" is the number of results to show.
Top N Results is useful when you have a lot of results and do not need to show all of them in the report, or when you want to highlight the top or bottom rows of a set, such as the highest or lowest numbers. Use Sort to change whether the Top N is in ascending or descending order.
You can preset an exact number of rows to return, or you can use a value chosen by a user from a dashboards filter.
Topics on This Page
Specify the Exact Number of Top N Results
- In a report, click Top N Results to open the Select Top Records pop-up.
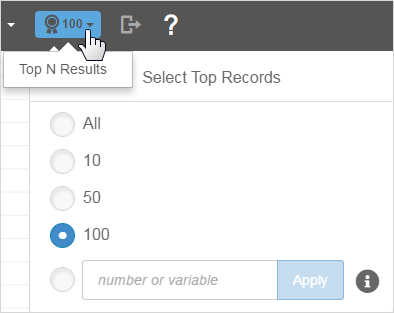
- Select an option or enter a number, then click Apply. The report updates immediately.
The Top N Results button displays the current number of results.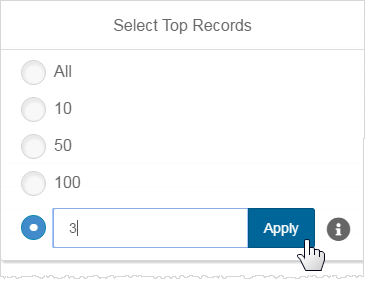

Use a Parameter Filter as the Top N Value
Use GETPROMPTVALUE to get the number of rows from a filter that is on the report.
- Create a parameter filter in dashboards. Use the Make Mandatory option to require a value.
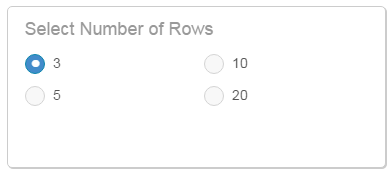
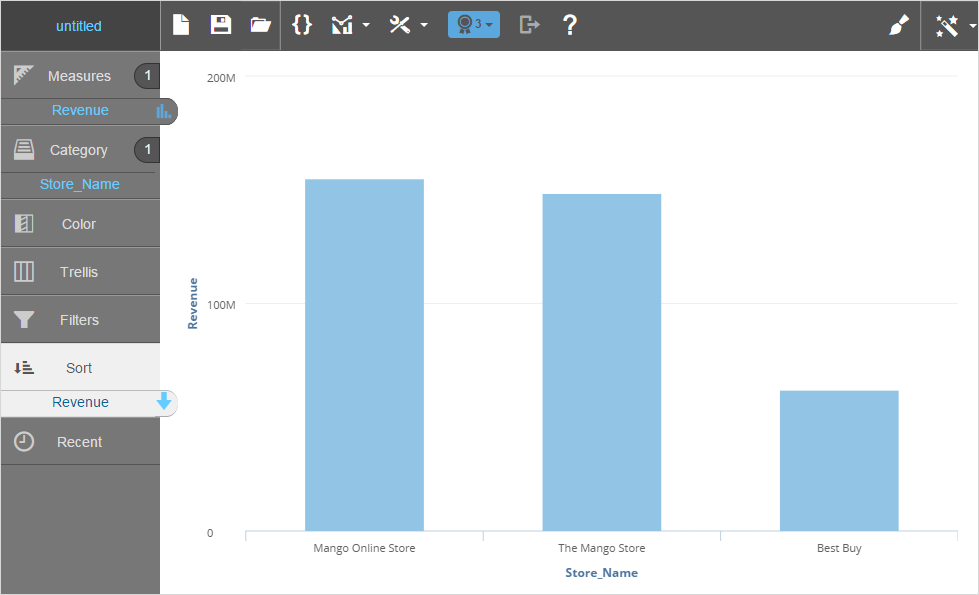
- In Visualizer, click Top N Results, then type the GETPROMPTVALUE expression in the Select Top Records pop-up. The first parameter is the name of the dashboard filter, and the second parameter is the default value: GETPROMPTVALUE('Select Number of Rows', '3'). Click Apply.
Visualizer validates the expression as you enter it. The Top N Results button in the Visualizer menu bar indicates that it is using a BQL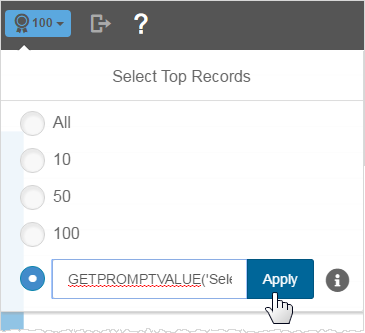
 Business Query Language expression.
 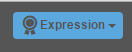 Note: When a user changes the filter, the report updates the Top N value.
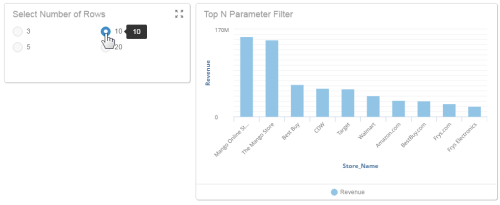

Tips for Using Top N
- By default, the Top N is set to 100 of the first rows returned by the query without a sort.
- In Visualizer, you can change the value for Top N either before you add measures and attributes or after a report is already created.
- For large result sets, using “All” can affect performance.
- A dashboards filter can pass a value to Top N using the BQL Business Query Language GETPROMPTVALUE function. During development, this value may not yet be available in Visualizer, in which case all rows are returned. You can add a default value to the GETPROMPTVALUE expression to see it work from within Visualizer. Once the report is added to a dashboard and the filter is applied, the value updates accordingly.
- Top N also supports the GETVARIABLE expression.
- When Top N is applied to a table, users can choose to view one of
two versions of the Grand Summary:
- “Local” Grand Summary associated with the visible result set after Top N has been applied;
- “Global” Grand Summary associated with the entire result set, independent of Top N.
- If you want the data ranked in order to show the top or bottom rows, first order the data, either ascending or descending, using Sort in Chart Builder.
- During development, use a table view to display the ordered set of data and determine the number to use for Top N.
- Ensure the Top N provides the information needed for your users and does not return unnecessary rows. Large result sets can affect performance and may be unnecessary for your users.

