Right Required: View Insights
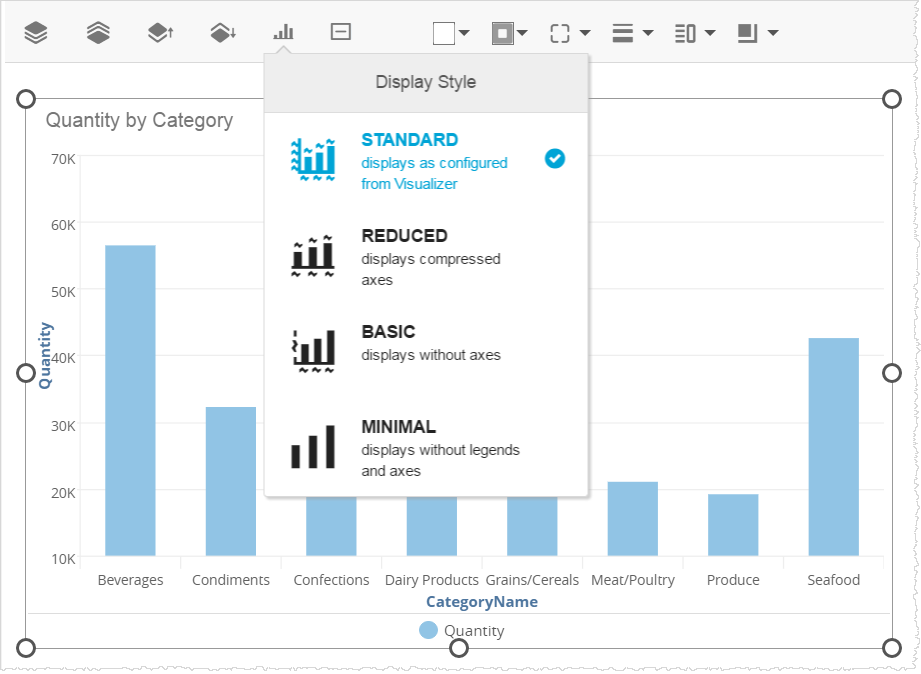
Chart Display styles are a way to change the formatting of Visualizer charts at the individual dashlet level. Element styles affect the way that axis, legends, and tick marks are displayed or not displayed.
Topics on This Page
Display Styles Overview
Display styles include:
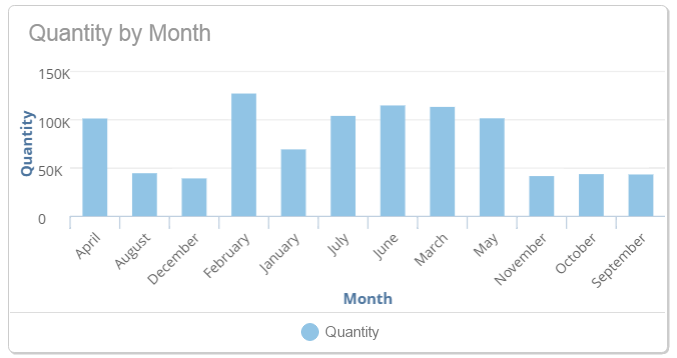
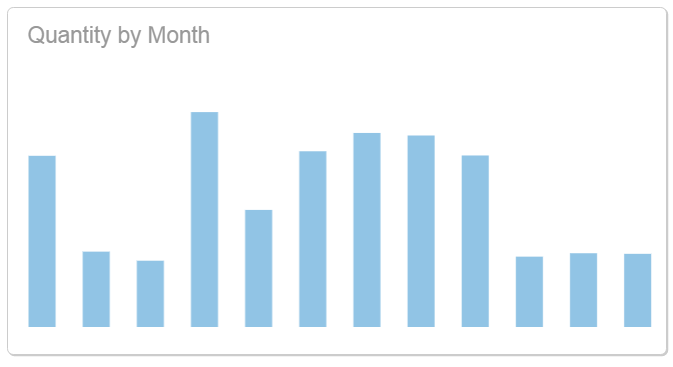
- Standard—The chart displays as it was designed in Visualizer. This is the default setting.
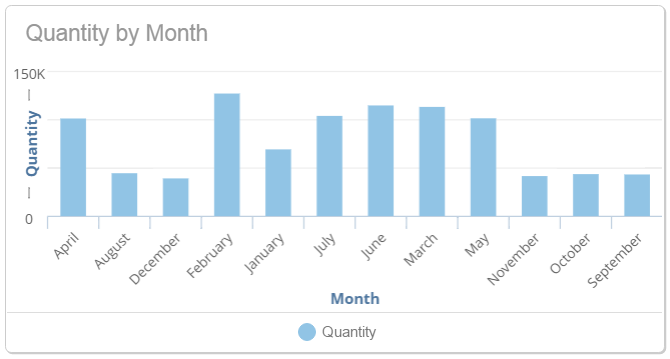
- Reduced—The y-axis is compressed.
- Basic—Axis and tick marks are not displayed.
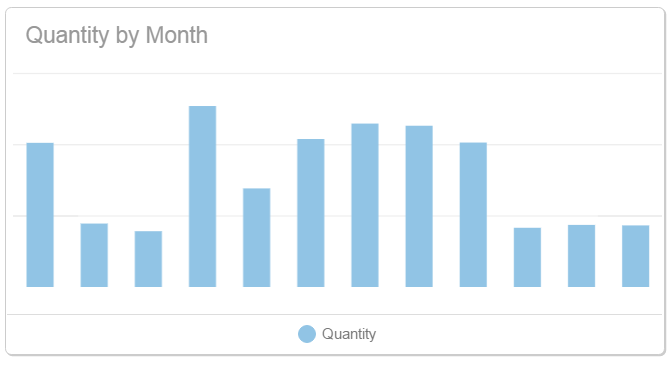
- Minimal—Axis, legends, and tick marks are not displayed.
Set a Display Style for a Visualizer Chart
- In Edit mode, select a dashlet. The dashlet highlights and the secondary menu appears at the top, with the Display Style button. Note: If you select a dashlet and the Display Style button does not display, then this feature is not supported for the report.
- Click Display Style and select one of the style options.
The report updates immediately.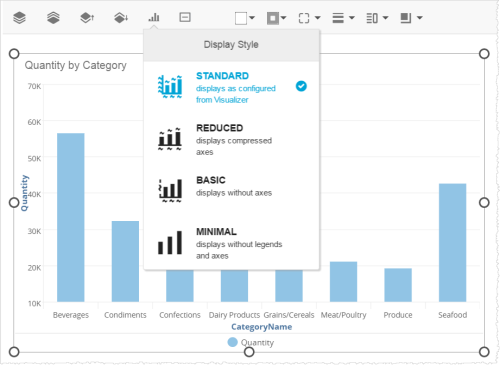
- Click Publish to save the settings.