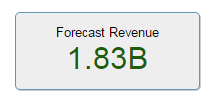
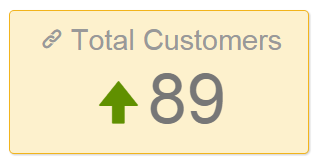
A Key Performance Indicator (KPI![]() Key Performance Indicator, a measurement of performance. Organizations measure activities related to successfully meeting their objectives, such as profitability or acquiring new customers.) widget displays the basic number of
any measure or expression. It can also include a title and an icon
indicator.
Key Performance Indicator, a measurement of performance. Organizations measure activities related to successfully meeting their objectives, such as profitability or acquiring new customers.) widget displays the basic number of
any measure or expression. It can also include a title and an icon
indicator.
The KPI Builder lets you,
- Select a measure or add a KPI expression;
- Format the measure;
- Re-title, toggle off, and format the title text;
- Add and format an indicator icon;
- Add an attribute and create a sparkline;
- Determine KPI format.
Set other KPI properties at the dashlet level:
- Description used for a tooltip.
- Background color, border stroke color, and border toggle.
- Drill-across link to another dashboard page.
- Adjust font size ratios.
- Make font size consistent across multiple KPIs.
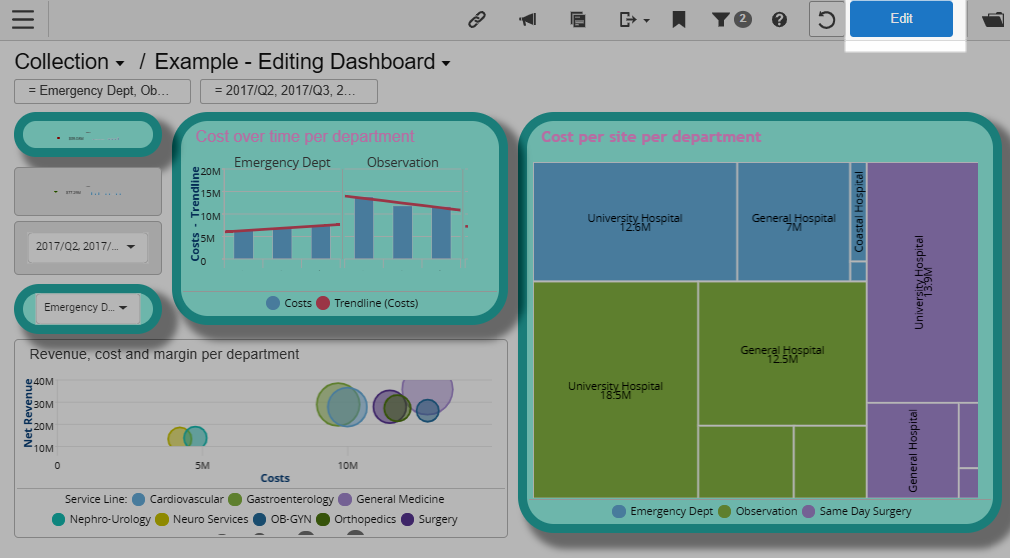
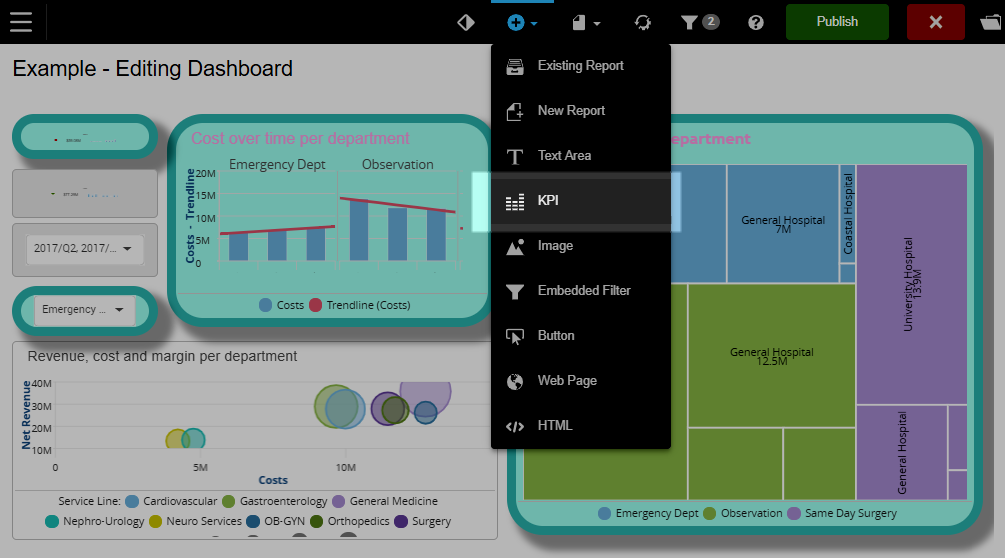
Add a New KPI
- From a Dashboard, click Edit.
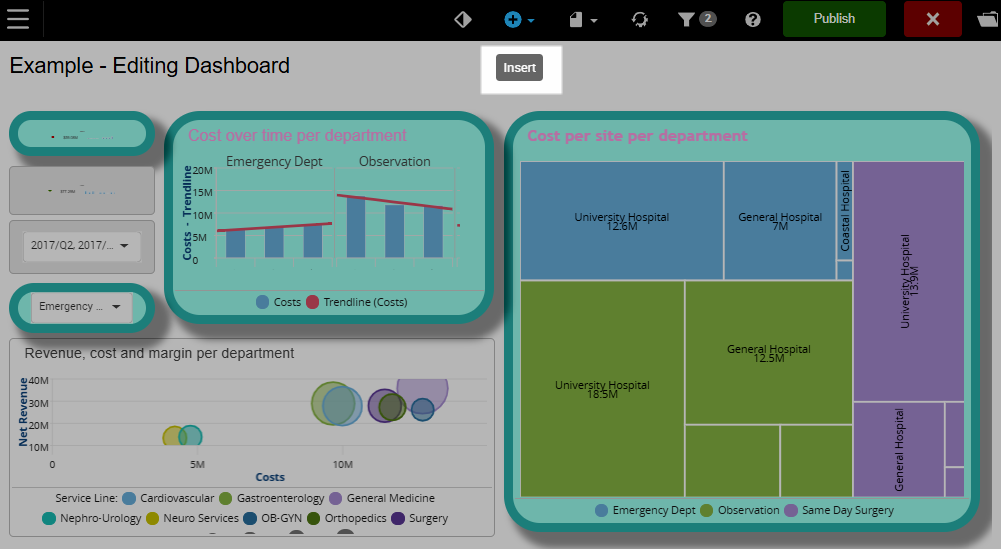
- Click Insert.

- From the menu, select KPI. The KPI Builder opens.

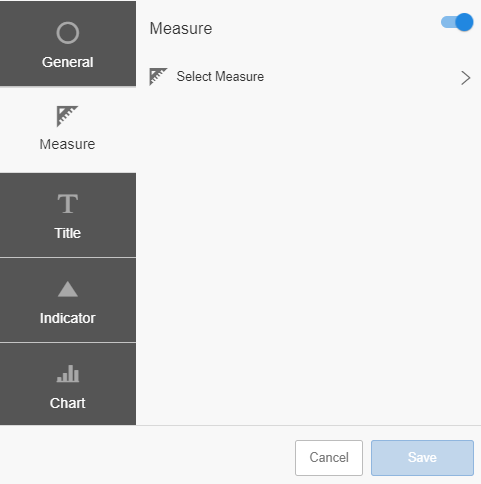
- In the KPI builder, you can do the following:
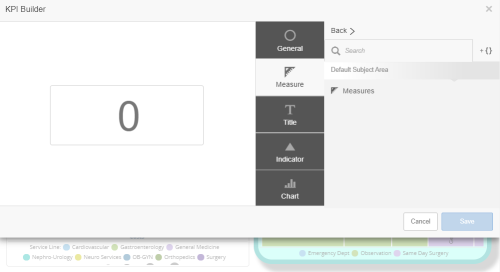 Note: As you enter the KPI measures and set its properties, the KPI Builder shows you a preview of the KPI.
 - Click Save when done.
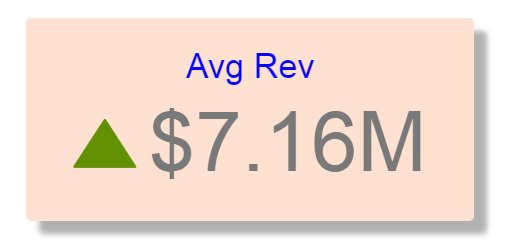
Examples of KPIs:

Select a Measure, Date Type, and Aggregate
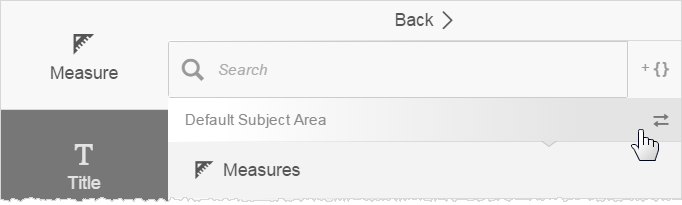
- From the KPI
Builder, select the Measure tab and Select Measure. The Default Subject Area automatically displays. Subject Areas are where attributes and measures are collected together.
- If a Custom Subject Area was created for the space, click the change Subject Area icon to access its measures.

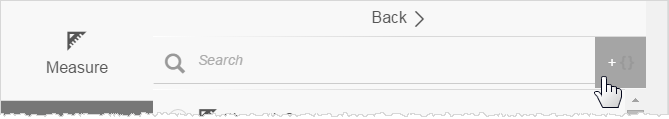
- Use Search to quickly find a measure when you know its name or click Measures to view all measures.
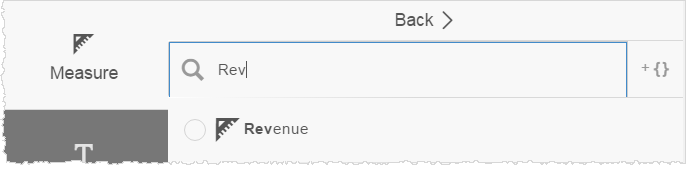
- Select a measure. The Measure options panel opens. Measures from Default Subject Areas and Custom Subject Area are defined differently.
- If the measure is from the Default Subject Area:
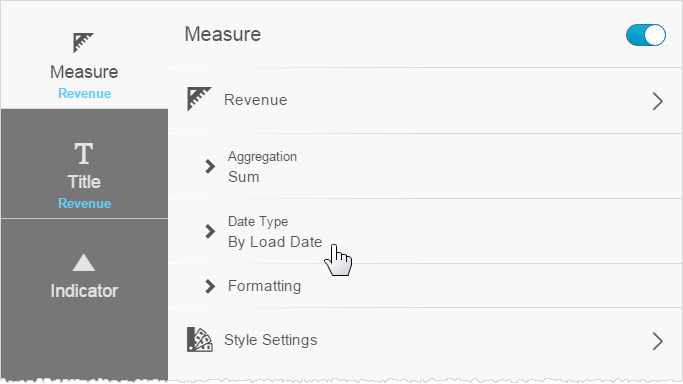
- Click to change the Aggregation type, if you don't want the default. Click Back when you are done.
- Click to change the Date Type. Usually you don't want the default, Load Date, that is when data was last refreshed in the space. You may rather want something like the Order Date. It depends on your particular analytical requirements.
- Click Back when you are done.
If the measure is from a Custom Subject Area:
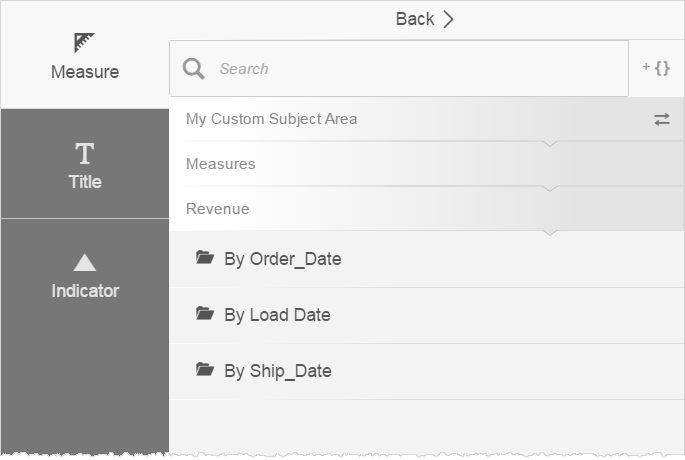
- Select the date type.
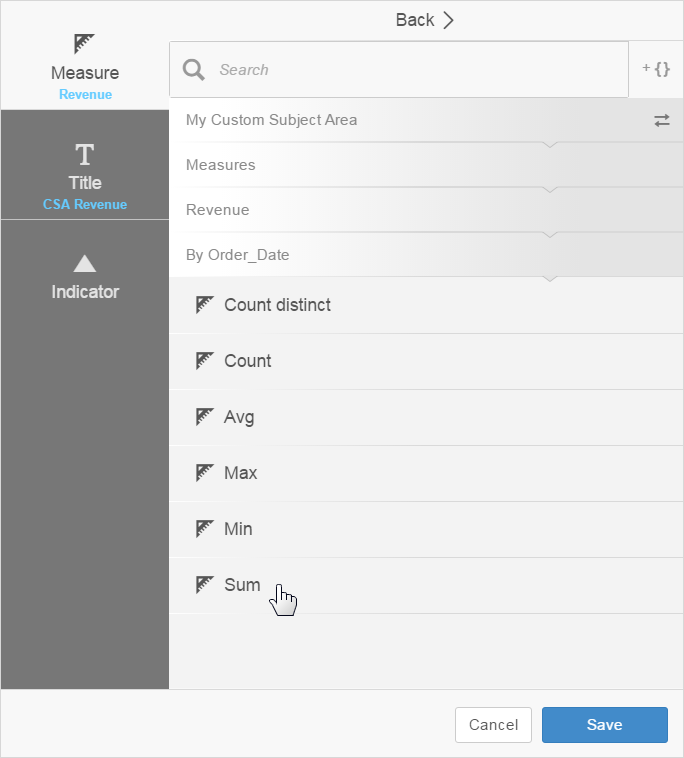
- Select the aggregation. The aggregation is how the KPI is calculated from the numeric data, such as a sum or an average.
- Click Save.
- Select the date type.
- If the measure is from the Default Subject Area:
Format a KPI
- From the KPI Builder, select the Measure tab.
- Click Formatting. You can format the following:
- Units—None (no commas), Thousands (K), Millions (M), Billions (B), or percent (%). The default Auto is chosen by dashboards.
- Suffix—By default there is no suffix label after the measure number. You can add the percent sign label (%).
- Decimal—0–3 decimal places, or All. The default Auto is what is used by the base data.
- Currency—By default there is no currency prefix label. Select one from the list.
- Click Back when you are done.
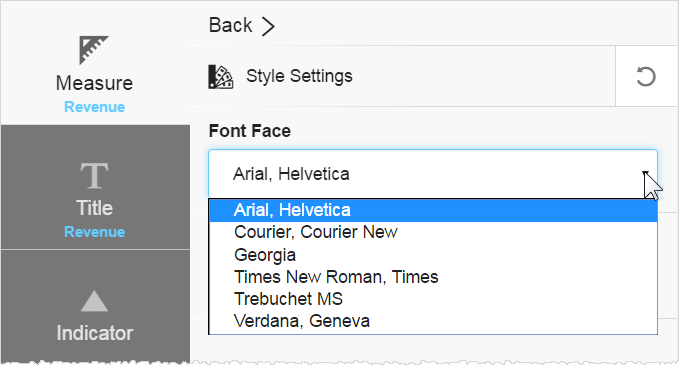
- Click Style Settings to apply styles to the measure.
- Select a font face from the list.
- Select a font color.
 Tip: You can enter the hex number for the color. This is helpful when you use standard colors and a have a list of their hex numbers.
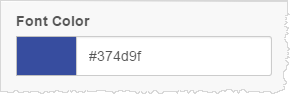
- Click Back when you are done with the Style Settings.
- If you don't
want to show the measure title but not the data, toggle the data off.
- Click Save. The KPI Builder closes and the KPI widget displays on the dashboard, where you can resize and move it to fit your dashboard design.
Add an Expression to a KPI
Some report expressions may already be listed in the KPI Measure list. Check the list before creating a new expression. Expressions created for a KPI are saved for only the KPI and cannot be shared.
- From the KPI Builder, click the Measure tab.
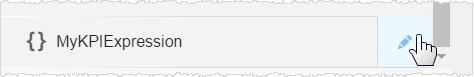
- Click the Add Expression icon. The Expression Builder opens.
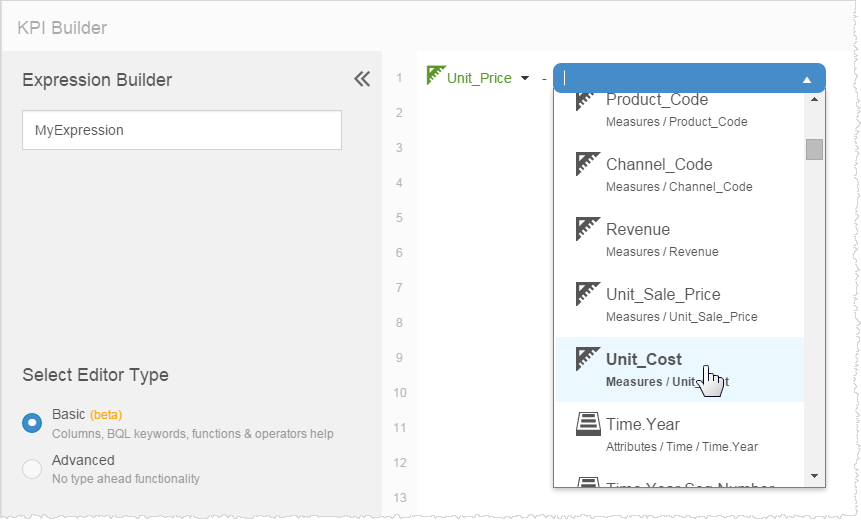
- In the Expression Builder, name the expression.
- Enter the expression.
 Optional: Advanced Query
If you are proficient in BQL
Business Query Language or have a pre-existing query:- Select Advanced mode.
- Enter or paste the query into the text field.
- Click Done.
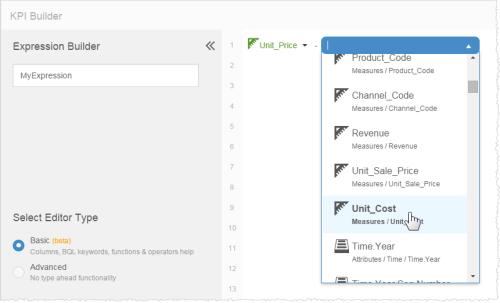
- Start typing the name of one of the existing measures in the Code field. Type-ahead search helps you find the relevant measures.
- Select the operator from the list or type a shortcut such as asterisk (*).
- Select another measure and iterate until the expression is complete.
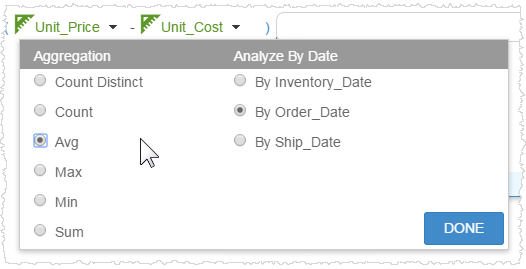
- Optionally, click the selected measure to change its Aggregation or Analyze By Date
settings, then click Done.
 Tip: The message "Expression is incomplete" displays at the bottom and Done is unavailable until there is a complete expression in the Code field.
 - Click Done. The title and value of the expression display in the KPI widget.
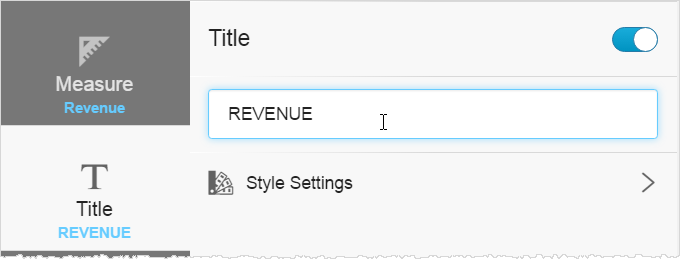
Change the Title of a KPI
- Click the
Title block to enter a different title, or you can toggle the title off
so it does not display.
 Tip: You can use variables with either the GetVariable('variable_name')or V{variable_name} syntax in the title.
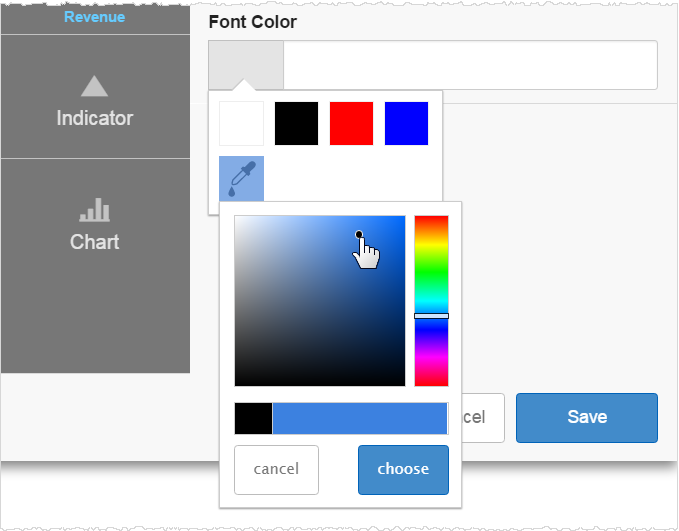
 - Click Style Settings to change the title font color. As with the measure, you can enter a hex value for the color.
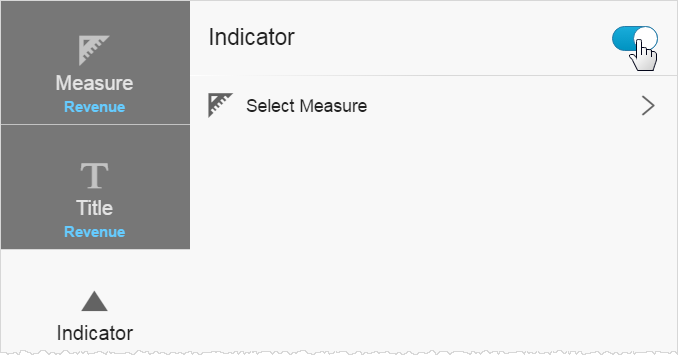
Add an Indicator Icon to a KPI
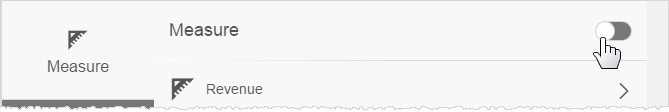
- In the KPI
Builder, click Indicator to add an indicator icon. It is toggled off by default, so first toggle it on.
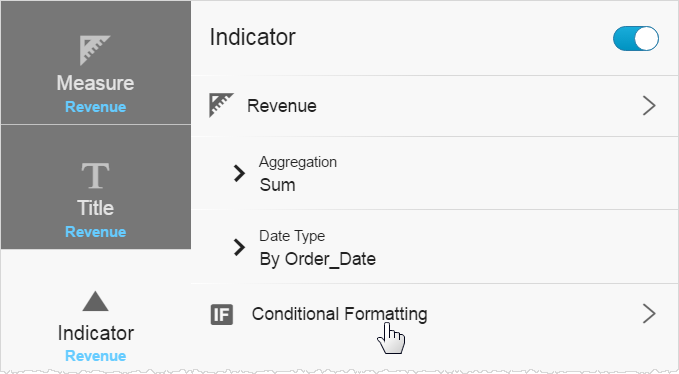
- Select the
measure or expression for the indicator.Tip: The indicator can use a different measure than the main KPI measure.
- Click Conditional
Formatting.
- Use the interval
buttons, value slider, and shape/color menus to specify the ranges to
apply to the indicator.
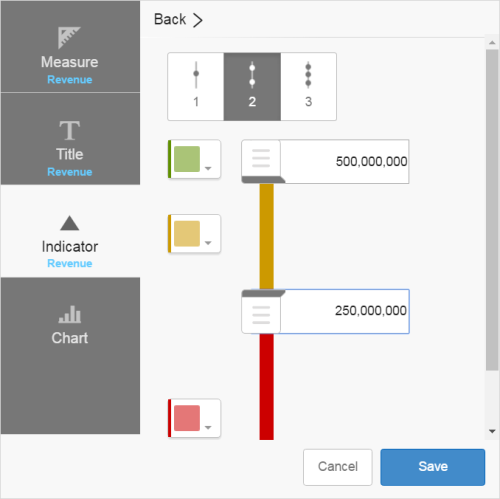
- Click Save.
The widget displays on the dashboard, and you can move and resize it just like
a dashlet.Tip: In some cases, you may need to Publish (Save) the dashboard to refresh the data and indicator.

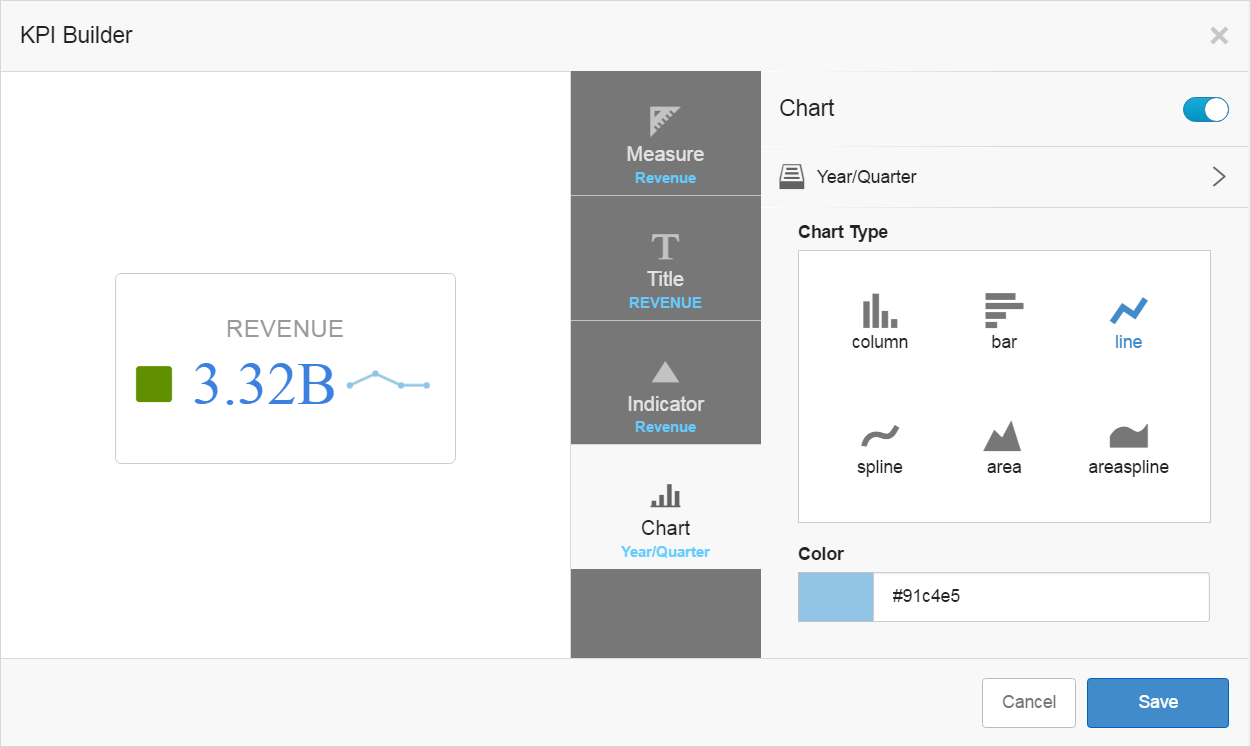
Add a Sparkline
A sparkline is a small graph that represents the measure of the KPI and an attribute. The sparkline chart formats include column, bar, line, spline, area, and areaspline.
- Choose an attribute.
- Pick a chart type.
- Select a color.

- Click Save.
- Click Close.
- Resize the KPI dashlet if needed. Tip: If a KPI is sized too small, the sparkline chart will not display.
- Publish (save) the dashboard. The dashboard user can hover over the sparkline chart to see additional information in the tooltip.
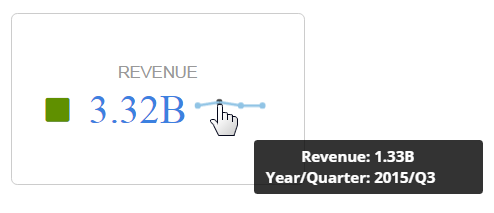 Tip: If a drill path is defined, the sparkline tooltip shows the drill icon, and the user can drill down.
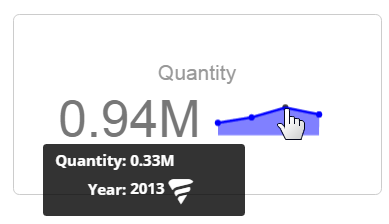
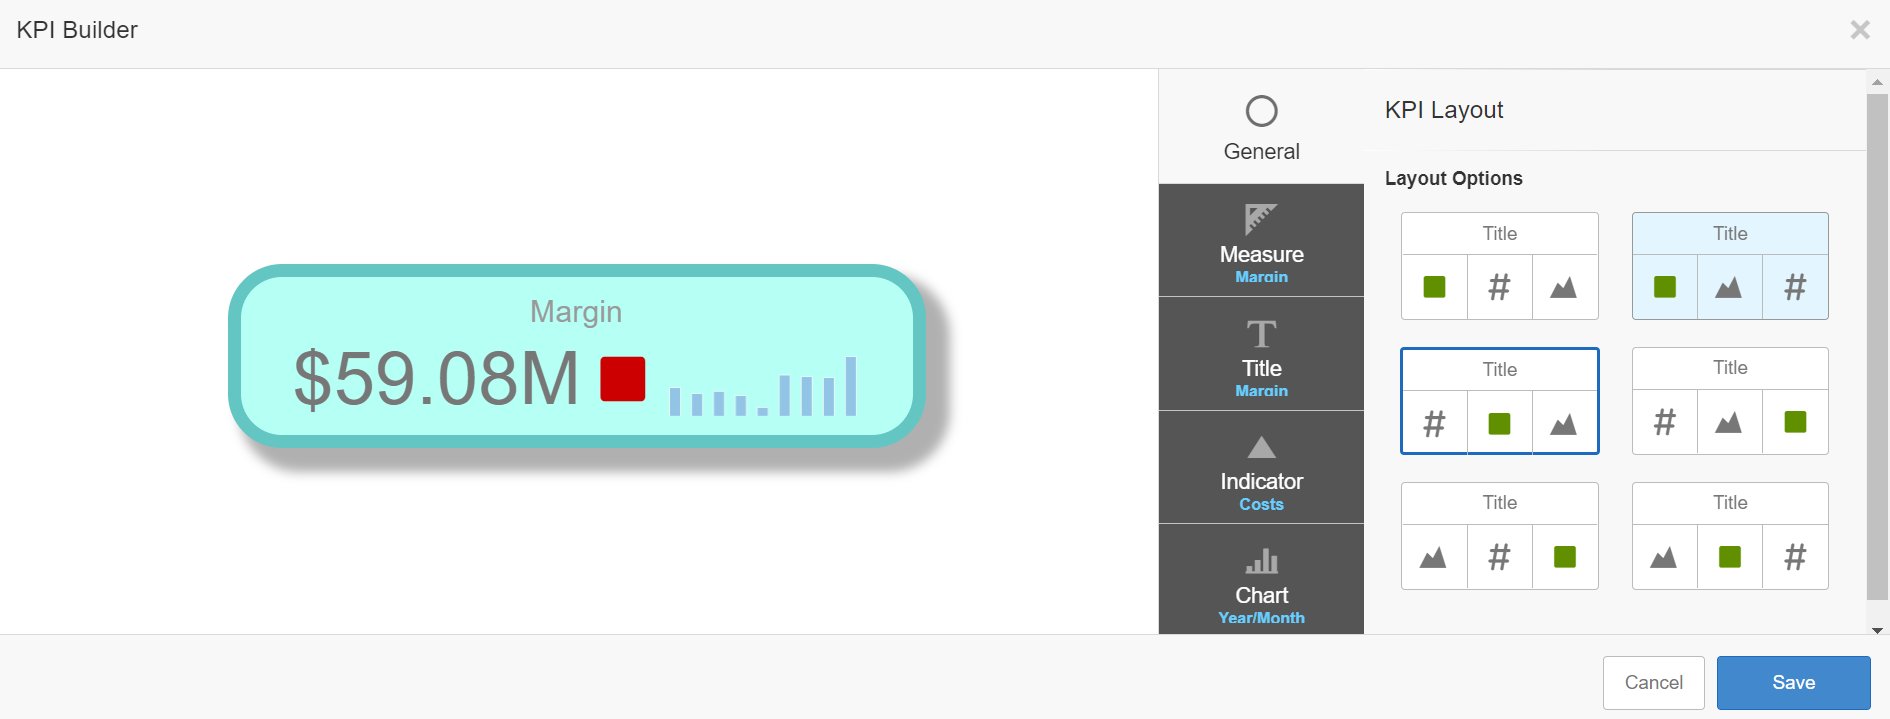
Select KPI Layout
- In the KPI Builder, select General.

- Under KPI Layout, select the preferred layout for the chart, indicator, and body text. The available options reflect which items are enabled on your KPI.
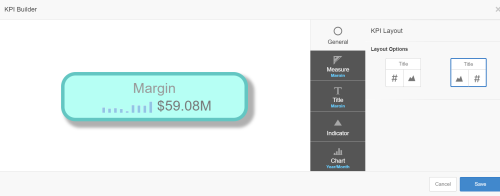
- Click Save.

Add a Tooltip
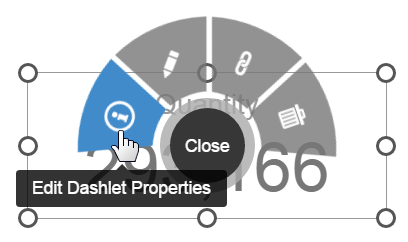
- Select the KPI.
- Click Edit.
- Select the Edit Dashlet Properties icon.
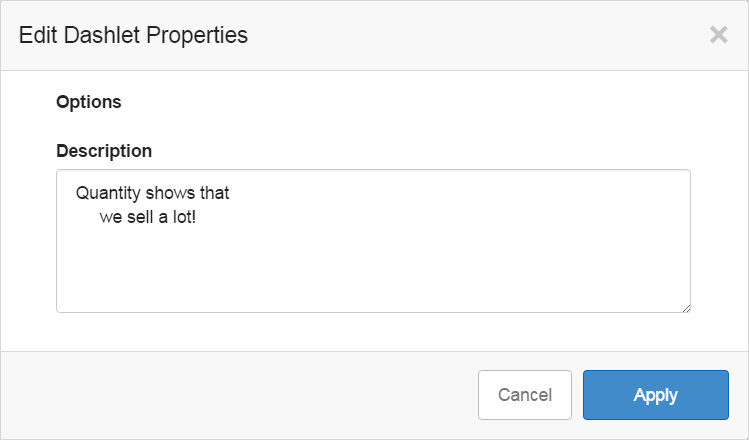
- In the Description box, enter the text you want the user to see. For more control over formatting, use carriage returns and extra spaces in the text.
 Tip: Use variables in the description box with either the GetVariable('variable_name') or Vvariable_name>} syntax. Contact your administrator if you need assistance using variables.
 - Click Apply.
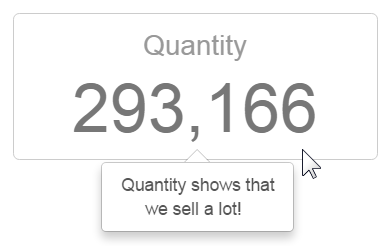
- Publish (save) the dashboard. Hover over the KPI to see its tooltip.
Change the Background and Border Color of a KPI
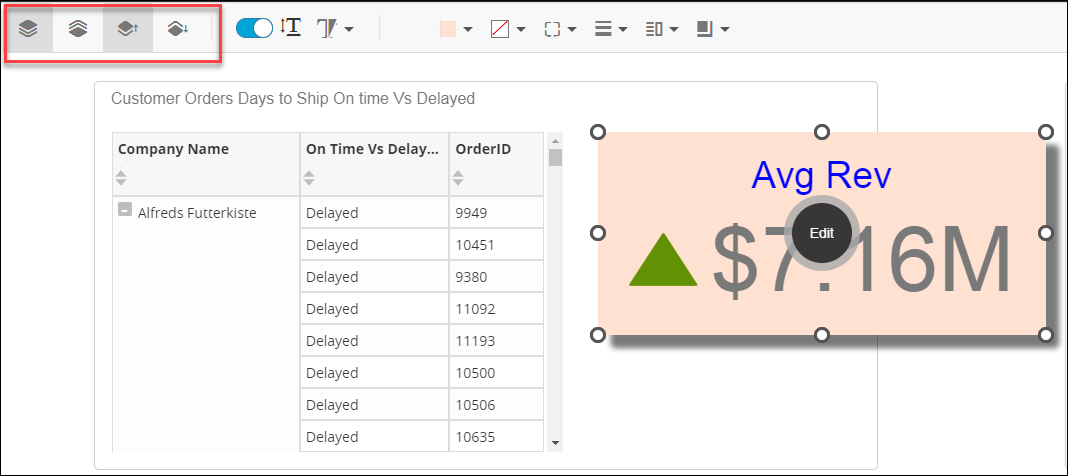
- Select the
KPI to activate the dashboard style bar. Note: The style bar functions will vary based on the dashlet you select or if you select multiple types of dashlets at the same time.
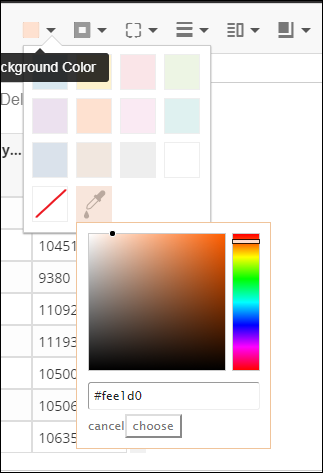
- Click the background color editor to change the background color of the selected KPI dashlet.

- Select the preferred background color. You can choose from suggested
colors or click the dropper to pick from a color slider which includes the option to enter a hex value. If you prefer no background color, select the red slash option.
- You can use the dashboard style bar to display or hide the border and change the color of the
border stroke. Similar to the background color, you can customize the color using the dropper or enter a hex value for the border color. If you desire no border, select the red slash option.

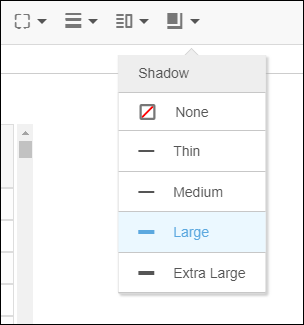
- There are additional features you can edit such as
border radius, border thickness, padding and shadow.
- The dashboard style editor also provides options to stack dashlets relative to each other.

- Click Publish to save all the changes.
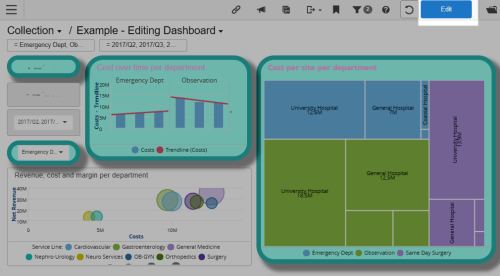
Add a Drill-Across Link to Another Page
- A drill-across link opens a specific dashboard page when you click on the KPI widget.
- Select the
KPI, click Edit, and select Drill Across.
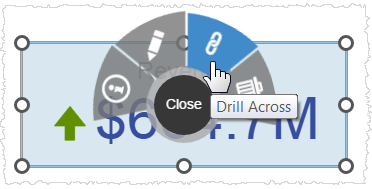
- From the Drill Across options, select a page and optional parameters, then click Apply. See Adding Drill-Across Links.
- Save (publish) the dashboard.
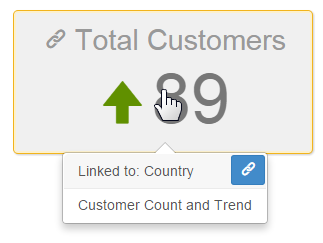
Tips:
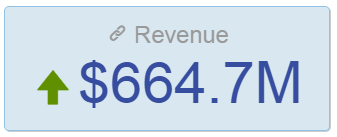
- The KPI shows a link indicator so that the user knows to click and drill.
- Hovering over a KPI reveals the linked page name and description, if
any.
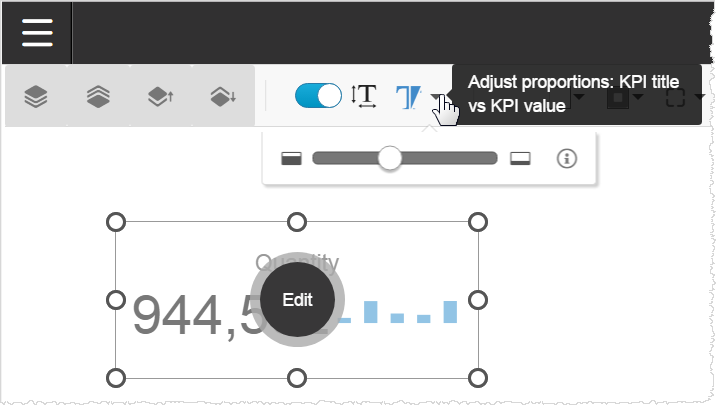
Adjust Font Size Ratios
The scaling ratio settings control the size of the title text versus the measure value number. The slider changes the sizes by proportion.
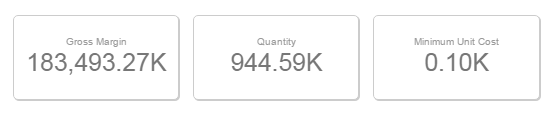
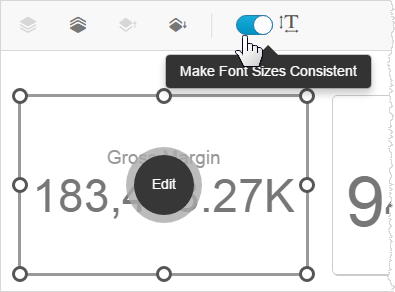
Make Font Sizes Consistent Across Multiple KPIs
The fonts inside KPIs are responsive and increases or decreases according to the size of the browser window or tablet screen. When you have multiple KPIs, this can result in inconsistent font sizing. If you prefer to keep font sizes consistent even as the dashboard or dashlet dimensions change, use the Make Font Sizes Consistent option.
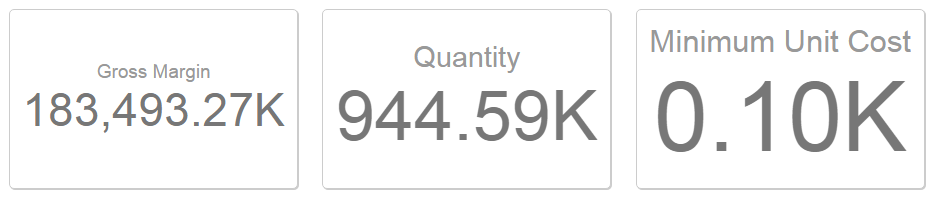
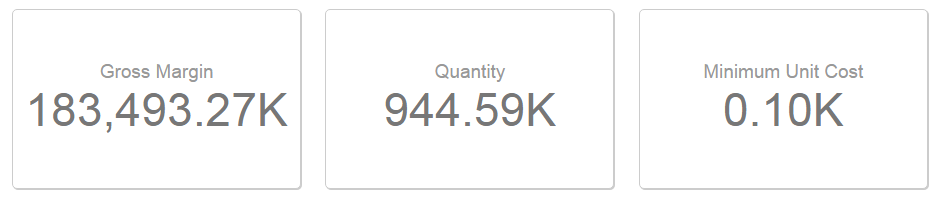
You can have multiple KPIs that have the same unit formatting, but the numeric ranges vary widely and the font sizes are all different.
- In Edit mode, select a KPI. The dynamic toolbar appears at the top of the dashboard and shows the Make Font Sizes Consistent option.
- Toggle the option.
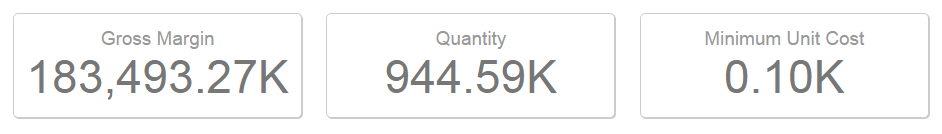
- Repeat step 2 for the additional KPIs. The font sizes become consistent.
 Optional: Resize Dashlets for Fonts
- You may want to resize the dashlets to account for the resized fonts. In this example, the KPIs could be a bit shorter, because the font size of the third dashlet is much smaller than before.
- You may want to resize the dashlets to account for the resized fonts. In this example, the KPIs could be a bit shorter, because the font size of the third dashlet is much smaller than before.
- Click Publish to save your changes. Notice that when you resize the dashboard, the KPIs retain their responsiveness while maintaining consistency.